Ministry of Energy and Mines
Home » Mining Lands Administration System (MLAS) » MLAS Help
MLAS Map Viewer Help
We are committed to providing accessible customer service. If you need accessible formats or communications supports, please contact us.
TThe Mining Lands Administration System (MLAS) map viewer application provides search and navigation tools providing interactive map functionality. Basemaps and imagery enhance a visual experience with the ability to create, modify and print custom made plotter size maps, as well as standard mapping products. Markup tools aid with identifying and displaying specific features on a map.
As part of our commitment to customer service, the Ministry of Energy and Mines will continue to provide excellence in mapping services including in meeting its obligation to comply with the Access to Ontarians with Disabilities Act (AODA). This legislation is intended to better accommodate people with disabilities while improving and maintaining the high standard of service that the Ministry of Energy and Mines provides to clients and the general public.
MLAS Map Viewer’s Disclaimer
Basic understanding of the MLAS Map Viewer’s disclaimer includes knowing that once you click the ‘I accept’ button, it means you understand the following:
- MINES maintains a public record of mining lands information known as the mining claims registry, and information regarding mineral tenure
- MINES makes available information other than mining lands information on this website for information purposes (“non-mining lands information”
- Non-mining lands information is provided free of charge for information purposes only, is provided “as is” without warranties or conditions of any kind, either express or implied
- It is the sole responsibility of the person choosing to access this site to verify the accuracy of any non-mining claim information
- MINES is not responsible for, nor does it independently verify any non-mining lands information, through field measurements or otherwise
- Land tenure and land uses that restrict or prohibit the registration of mining claims or their use may not be accurately illustrated; users are advised to independently verify the location of tenure and uses
- MINES makes ongoing efforts to provide accurate and complete mining lands information; as a result, mining lands information is subject to change without notice and users are advised to review this website on a regular basis, and/or contact the Provincial Recording Office.
- Ontario's Terms of Use must be adhered to while using this website.
Toll Free: 1-888-415-9845
Email: pro.ndm@ontario.ca
The maps accessed through this site are not intended for navigational, survey, or land title determination purposes. Maps accessed through this site may not show unregistered land tenure and interests in land including certain patents, leases, easements, rights of way, flooding rights, or licences
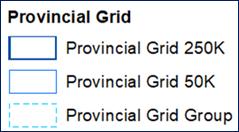
The initial map displays 3 layers: Provincial Grid at 1:250,000 which is like the 1:250K National Topographic System (NTS). 9 Mining Divisions, the Ministry of Natural Resources & Forestry’s (NRF) Crown Lands Use Policy Atlas (CLUPA) dataset for the Far North planning area.
There are over 35 available (scalable) layers that can be toggled on or off with most having a customize label option. 14 layers are active by default and will display when zoomed in. There are 2 background datasets, a topography base layer (on by default) and an imagery layer (Orthophotography - aerial photography and satellite imagery) that can be viewed independently or together, each with a transparency scale bar. (Ontario Imagery Copyright Notices Revised [PDF])
MLAS Map Viewer Overview
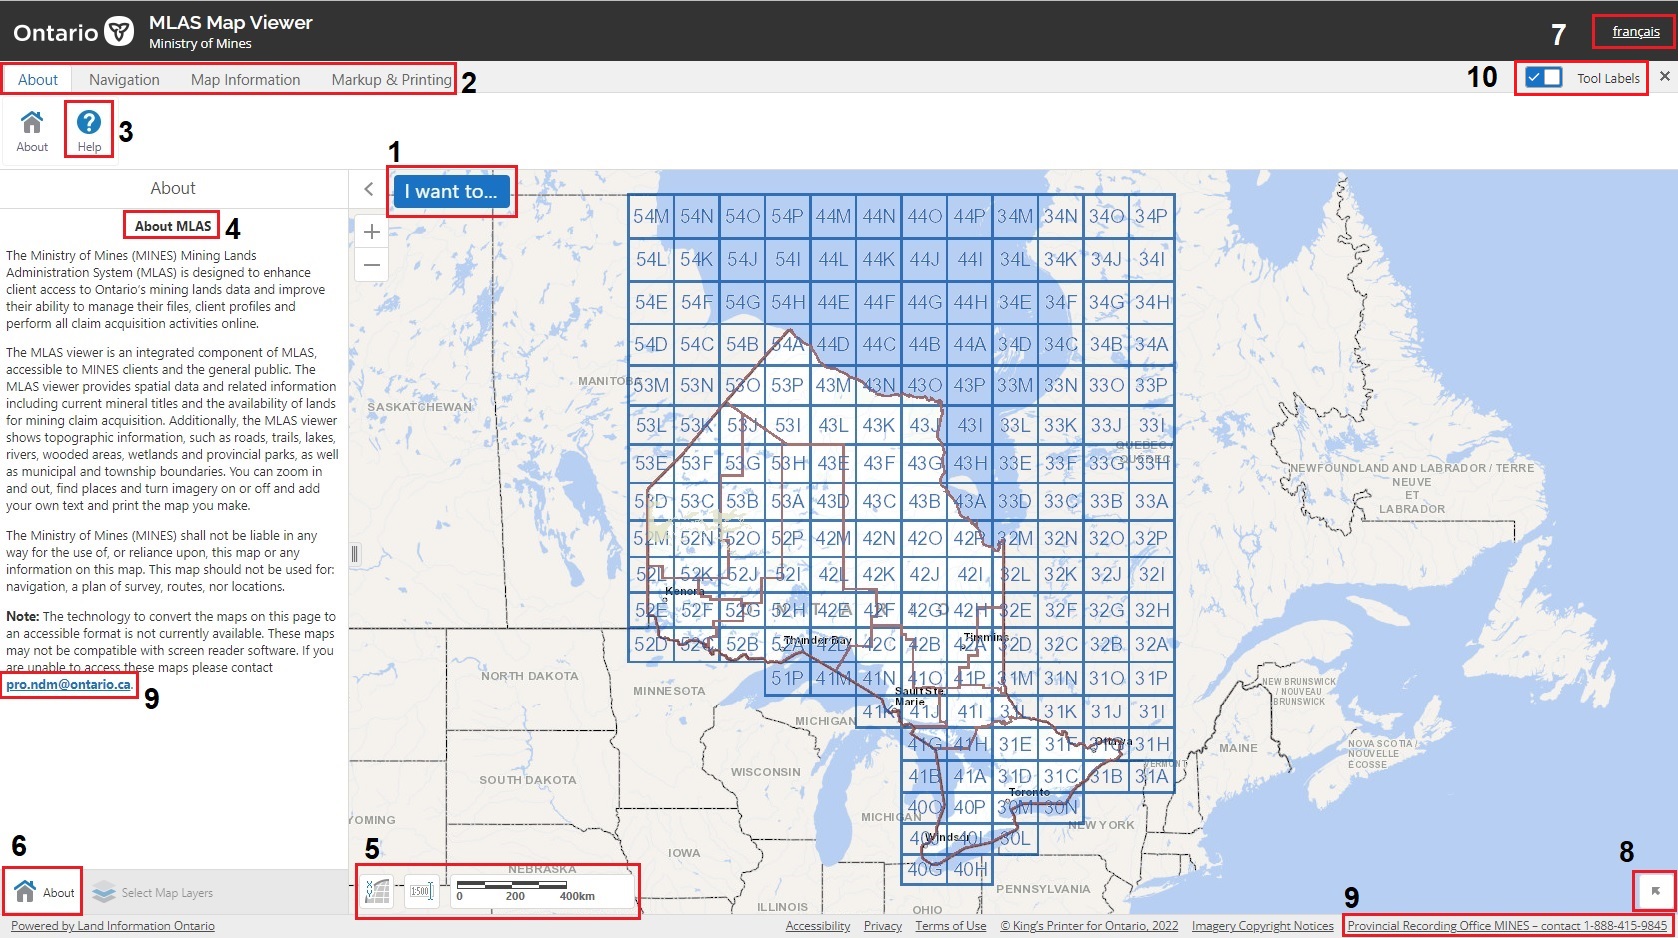
- – ‘I want to…’: Quick reference to common searches such as for a mining claim, bookmarks, etc.
- – ‘Toolbars’: Various toolbars with collections of interactive mapping tools such as ‘identification’, ‘Query’, ‘Print’, ‘Draw’, etc.
- – ‘Help File’: Displays in detail map functions, tools and options.
- – ‘About’: Mining Lands Administration System (MLAS) and the map viewer summary.
- – ‘Map Coordinates & Scale’: Select a Map unit (UTM, Geographic – Lat/Long DDM), and/or scale.
- – ‘Active Tool’: Switch between toolbars using the various tabs.
- – ‘français’: Viewer can be viewed in French.
- – ‘Inset’: Turn on or off an inset map.
- – Contact the Provincial Recording Office with mapping and/or Map Viewer concerns
About and Help
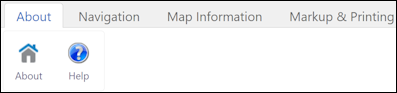

Provides a brief overview describing the Map Viewer as being an integrated component of the Mining Lands Administration System (MLAS) that is available for both MLAS client users and the general public. Summarizes the available mining lands datasets as well as several topographical background datasets and available base map caches

This ‘Help’ file is located on a webpage that can be downloaded to your computer. The ‘Help’ file provides an overview of each available tool to assist users to maximize and appreciate the many functions of the Map Viewer’s capabilities.
Map Navigation
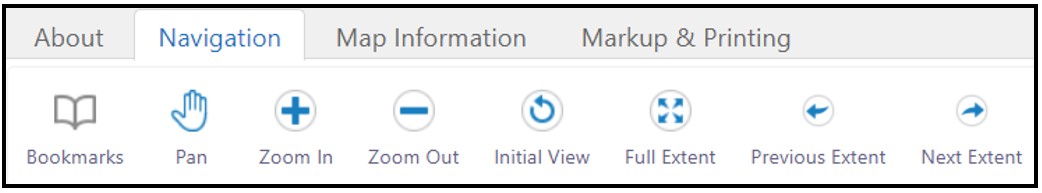
Bookmarks
![]() (also found in the ‘I want to….’ tool)
(also found in the ‘I want to….’ tool)
Bookmarks are stored spatial locations in the users’ browser cache and typically remain there till the browser’s history is cleared. Bookmarks are used to revisit areas in the map viewer for a quick reference instead of zooming/panning/querying to previously viewed areas. When viewing a specific interest or zoomed to an of area of interest that you wish to re-visit at a later time during your current session, click on ‘Bookmarks’ from the Navigation tab, or alternatively, the ‘I want to’ list of shortcuts. This will open a window where the user provides a unique name/ID associated with the area of interest as a reminder. Click on the ‘+’ sign to open the dialogue entry
This can be repeated for as many places/points within the viewer the user wishes to revisit at any given time during the open session.
Clicking on the ‘Bookmarks’ will open the window with the listed ‘Bookmarks’ to either revisit an existing bookmark, click on the name/identifier and/or create another entry/area of interest. To remove a bookmark, click on the 'X’
Pan
![]()
The ‘Pan’ tool is a typical map viewer tool that allows the user to essentially grab the view in the map viewer and move the view/location in any direction to a defined area/point on the map. By default, the ‘panning’ option is always available, left click anywhere on the map and move the view in the direction as desired.
Zoom
The ‘Zoom In’ and ‘Zoom Out’ tools are typical intuitive map viewing tools where the user can click on either tool and draw a rectangular/square box to zoom in, or zoom out, of a specific area/point on the map. By default, the ‘scroll’ button on a computer mouse can be used to zoom in or zoom out of the current map on the viewer.
Extents
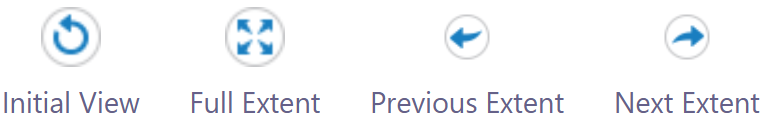
The Initial View brings the map viewer back to the scale and location, centering it to where the map viewer first opens. The ‘Full Extent’ zooms to the provincial scale anywhere in the viewer. ‘Previous Extent’ function provides the user an option to quickly go back to areas of interests. The ‘Next Extent’ will bring the user right back to the last extent after going to a previous extent. This function is basically a back and forth option. Full Extent (Initial View) are also found in the ‘I want to….’ tool)
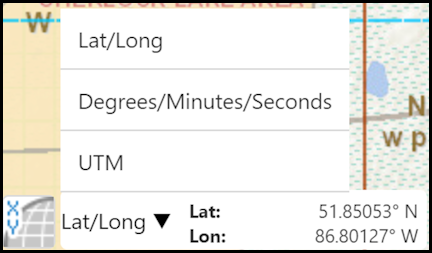
How to change the Map Coordinates and Scale
- Click the XY icon
 at the bottom left corner of the map viewer
 - The map will display the current coordinate system of the map
- Click on the arrow and select the desired option
'I Want To' Toolbar
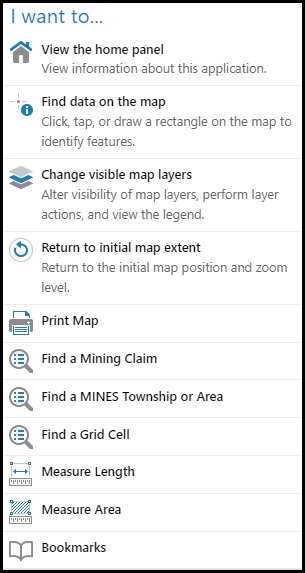
The ‘I Want To’ toolbar is a quick way to access the most common tools in the MLAS map viewer. All the tools in this toolbar are also available by navigating through the other toolbars. The tools available in this quick access toolbar include:
- View the home panel (for details on MLAS)
- Identify features on the map
- Manage layers
- Zoom back to original map view
- Print map
- View Selection *will appear when there is a starred selection
- Find a mining claim
- >Find a MINES township or area
- Find a grid cell
- Measure length
- Measure area
- Show bookmarked views
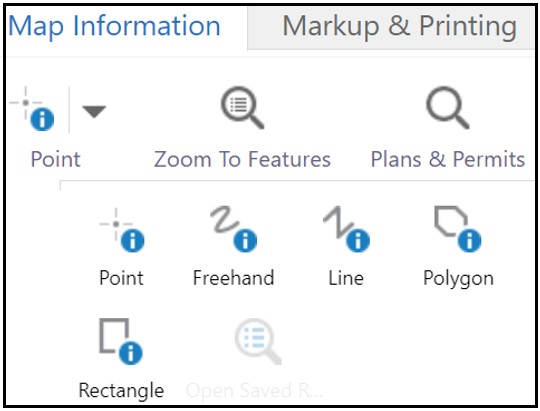
Map Information

 (also found in the ‘I want to….’ tool)
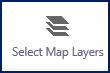
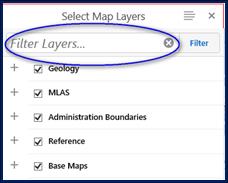
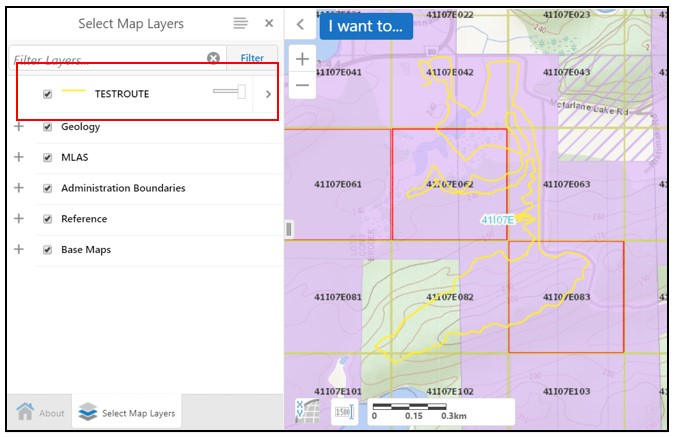
The ‘Select Map Layers’ allows the user to view up to 35+ (scalable) data layers. Clicking on the function opens the data layer window with ‘Filter Layers’ and ‘Change Layer Drawing Order’ options.
Filter Layers and Changing Layer Drawing Order
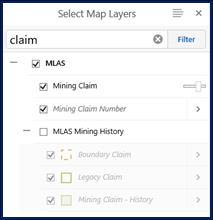
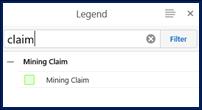
Filter Layers – The layer list is shown by default and allows the user to click layers on or off, also allows the user to quickly search/view only those layers of interest by searching using key words.
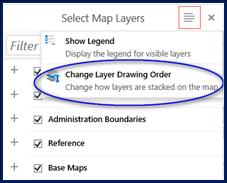
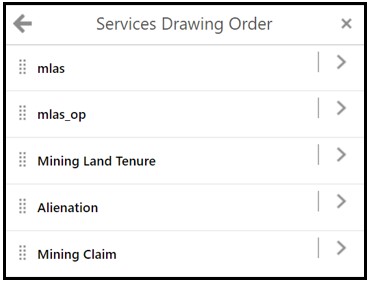
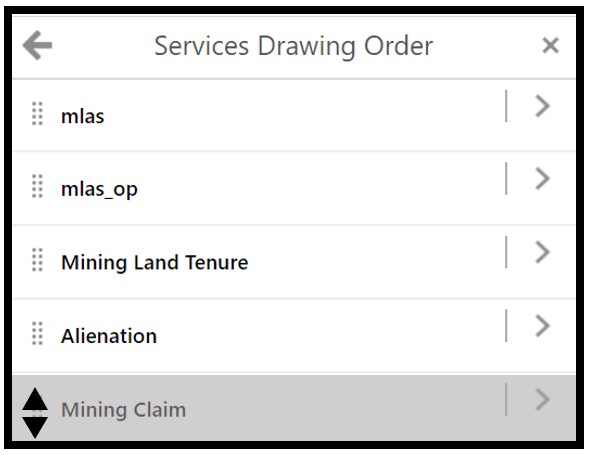
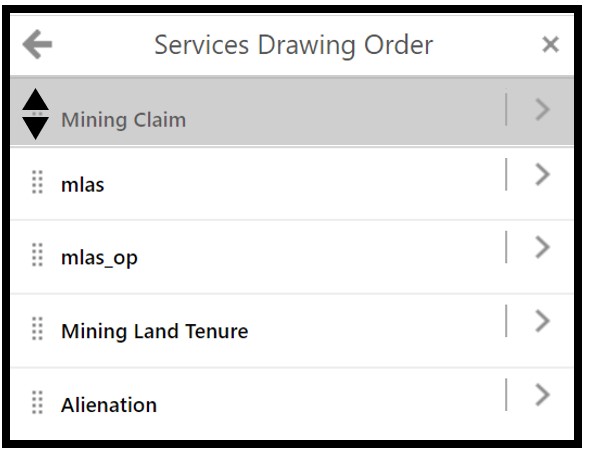
Drawing Order – Click on the menu icon ( ![]() ), then click on the layer(s) you want to re-arrange using the up/down arrows, move the layer to the order in which you want the layers to appear.
), then click on the layer(s) you want to re-arrange using the up/down arrows, move the layer to the order in which you want the layers to appear.
Labelling & Customizing Labels
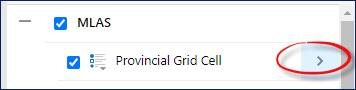
Most layer attribute fields can be displayed on the map as text using the label tools. To access the labelling tools, open the 'Select Map Layers' window, and click on the 'Chevron' beside a layer that you would like to label.
![]()
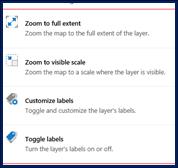
Click on ‘Toggle labels’ to turn labels on or off

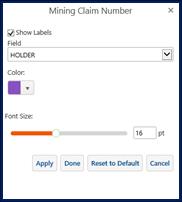
Click on the ‘Customize labels’ to access more settings for labels. The Customize labels tool allows users to turn labels on or off, select which attribute field is used for creating labels, choosing label font size, colour and transparency. Label settings can also be set back to default from this window.
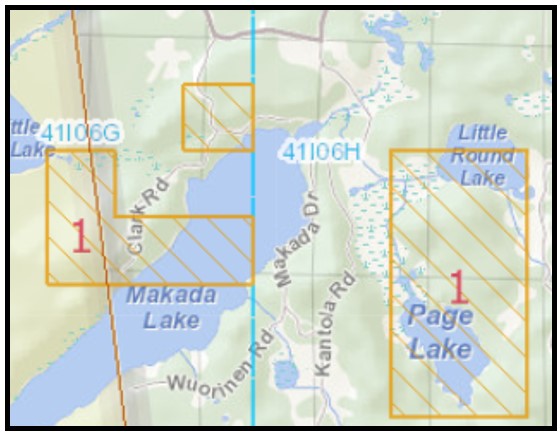
Customized labels are now visible on the map
Legend Item Details
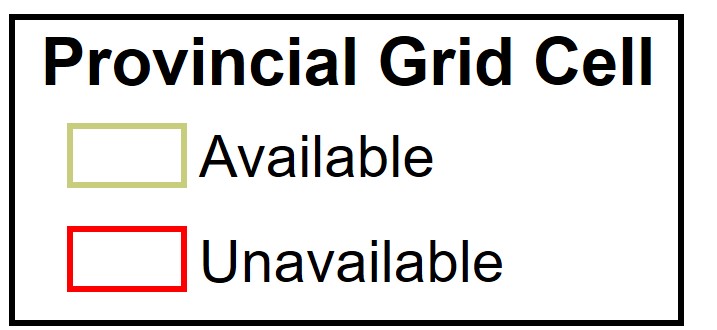
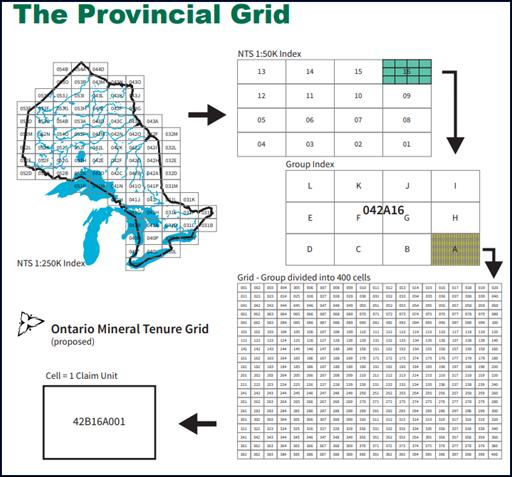
Ontario’s Mining Act defines a Provincial Grid Cell as:
……“provincial grid” means the prescribed digital representation of the province of Ontario, divided into unique cells each measuring 15 seconds latitude by 22.5 seconds longitude; (“grille provinciale”)
![]()
Provincial Grid Cell available to be registered as an unpatented mining claim subject to available Crown lands open for mineral exploration.
![]()
Provincial Grid Cell not available for registration: either no Crown lands available, and/or less than 25 hectares, contact the Provincial Recording Office for the latter.
Ontario’s Mining Act defines a Cell Claim as:
….“cell claim” means a mining claim, other than a boundary claim, relating to all of the land included in one or more cells on the provincial grid, subject to the limitations set out in
subsection 38 (5); (“claim sur cellule”)
Ontario’s Mining Act defines a Boundary Claim as:
……..boundary claim” means the part or parts of one or more legacy claims that on the conversion date under section 38.2 are located within a single cell on the provincial grid and converted to a boundary claim in accordance with paragraph 3 or 6 of subsection 38.2”
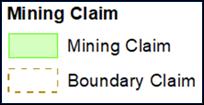
![]()
An Unpatented mining claim is the land available to explore within a cell’s extent and can consist of one or more (up to 25) contiguous cells.
![]()
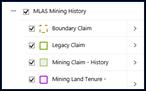
Boundary claims are identified in cells were there are multiple claim registrations as a result of conversion (Mining Act section 38.2) See section: Understanding Boundary Claims of this ‘help’ document. Also note, this layer in the MLAS Map Viewer is off by default, it can also be downloaded as shape file, along with all of the Mining Lands Sections lands datasets on the MLAS Map Viewer page.
Download Data section found on the above webpage
The Section 185(4) of the Mining Act:
Withdrawal of lands from prospecting, etc.
(4) Where application is made for an order under subsection (1), the Minister may direct the mining lands or mining rights described in the application to be withdrawn from prospecting, mining claim registration, sale and lease until the disposition of the application.
R.S.O. 1990, c. M.14, s. 185 (4); 2009, c. 21, s. 101 (4); 2017, c. 6, Sched. 2, s. 82 (2)
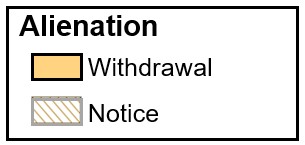
![]()
Crown lands are withdrawn from registering a mining claim for various reasons. Each withdrawal order can be viewed on the Land Notices, Withdrawals and Reopenings page.
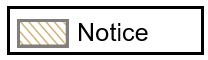
Usually where Crown lands are being considered for other uses that may coexist with mineral rights, and/or at a preliminary discussion stage potentially impeding future mineral exploration. The notice is provided for prospectors to make a sound decision when registering cell claims.
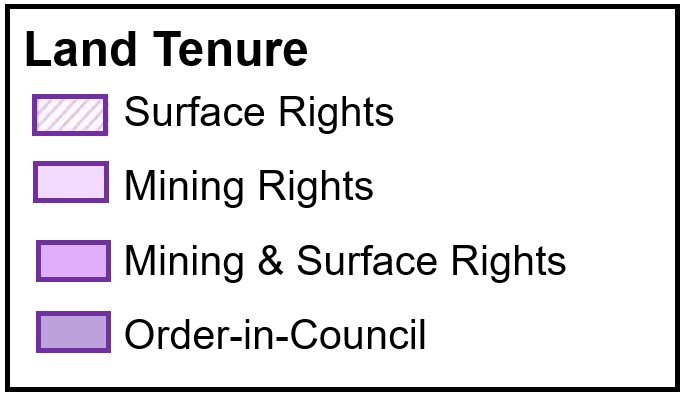
Land tenure is a form of ownership of rights of a parcel of land. For both mining and non-mining tenure, the relationship that individuals and groups hold with respect to land and land-based resources, such as trees, minerals, pastures, and water, etc. Land tenure rules define the ways in which property rights to land are allocated, transferred, used, or managed (LandLinks).
![]()
Surface rights ownership established, but mineral rights potentially available for exploration purposes
![]()
Mineral rights ownership established, but surface rights potentially available
![]()
![]()
Tenure acquired through an Order in Council; lands not available
Mining lands tenure are labelled opposed to Non-mining lands tenure which are not labelled
Mining lands Tenure
LEA – xxxx (Mining Lease) Granted by the Ministry of Energy and Mines
PAT – xxxx (Mining Patent) Rarely granted, if and when, by the Ministry of Energy and Mines
MLO – xxxx (Mining Licence of Occupation) Not granted
Please NOTE: Land rights and ownership verification is the responsibility of the prospector/land tenure owner to confirm through perspective land Title/Registry offices.
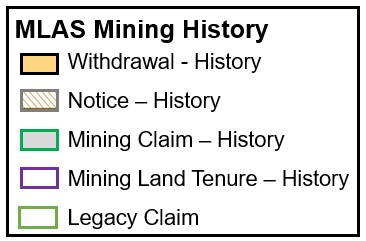
Mining Lands History datasets include legacy claims as of April 10, 2018. Current and most historical withdrawals are either available online and/or call the Provincial Recording Office and if on file, a copy can be provided for a fee. Email pro.ndm@ontario.ca or call toll free at 1-888-415-9845. Also, historic cancelled legacy claim datasets from 2001 to 2017 are potentially available upon request.
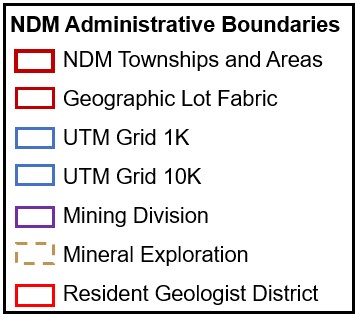
Administrative Boundaries
![]()
A derivate of geographic townships and 1:250k quartered Base Map sheets (Areas) to provide a complete Provincial cover
![]()
Natural Resources and Forestry (NRF) surveyed townships dataset of lots and concessions
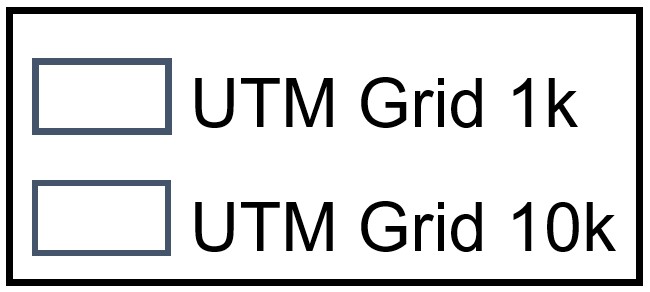
These UTM grids are static images labeled with UTM Zone, Easting the Northing projected coordinates regardless which coordinate system the Map Viewer is set at.
![]()
There are 9 Provincial Mining Divisions: Kenora, Larder Lake, Red Lake, Patricia, Porcupine, Sault Ste. Marie, Sudbury, Southern Ontario, Thunder Bay
![]()
There are 3 Mineral Exploration & Development Regions: Northwest, Northeast and South
![]()
There are 9 Provincial Resident Geologist Districts: Kenora, Kirkland Lake, Patricia, Sault Ste. Marie, Sudbury, Southern Ontario, Thunder Bay North, Thunder Bay South, Timmins
Other Administration Areas
![]()
The Ministry of Natural Resources and Forestry (MNRF) Districts dataset is provided by MNRF.
![]()
Crown Land Use Policy Atlas is a MNRF dataset and for the purpose of the Map Viewer, data is only available for the Far North
![]()
Native Reserves are surveyed lands the Canadian Government has reserved for Indigenous communities and not to be confused with Treaty areas and/or Indigenous Traditional Land Use areas.
![]()
Lands owned and/or administered by the Canadian Government
Geology
![]()
Abandoned Mine Information System (AMIS) sites is general location on Mine Site (often, coordinates based on office location or general site location)
![]()
AMIS Features are any mine hazards found on that site, every feature will have its own coordinate (ie: shaft, open pit, underground workings etc..)
![]()
Exploratory mineral drill hole for extracting core samples
![]()
Mineral Occurrences - supported documentations such as reported in the Ontario Geological Survey Publication releases
![]()
Faultines, Iron Formation Lines, Dike Lines, Bedrock Geology
![]()
Quaternary and Surficial Geology
For more information on Ontario’s geology, please contact any of the Ministry’s Resident Geologist Program offices throughout Ontario. (Toll Free at 1-888-415-9845)
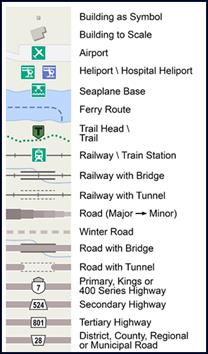
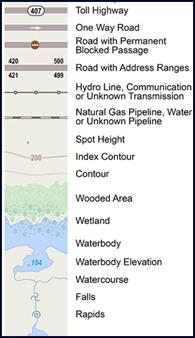
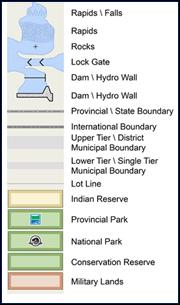
Topographic features are displayed from cached map pictures. These cached map picture datasets are also scale dependent. As you zoom in, more features will be displayed. Labels and feature symbology are static and cannot be customized.
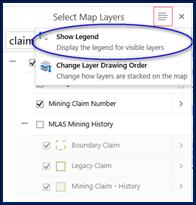
Dynamic Legend
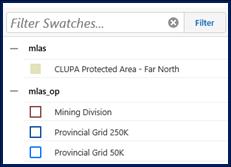
Click the menu icon on the Select Map Layers tab, then click on ‘Show Legend’ to view what layers are available at the current map viewer scale and/or as filtered on the current map viewer scale. As the user zooms in or out, the available layer will be listed. Provides a quick reference to the symbology or ‘swatch’ for each layer of filter for a layer of interest.
![]()
Static Legend

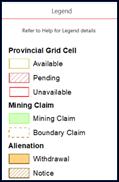
Clicking on the ‘Legend’ provides the user with an overview of the map’s topographic and layer features. It is a quick reference, though the user can search for more details within the help menu.
Find Layer Data (Identify)
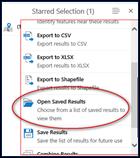
The ‘Find Data’ tool (or identify) provides users with the ability to find/identify information of multiple features of one or more layers. Clicking on the down arrow opens a menu of selection tools with the option to save results. (also found in the 'I want to….’ tool)
Enhanced Selection tools showing options for multiple or single selection
To learn what's there, draw a shape on the map. Double-click/tap to finish.
View ‘Find Layer Data’ results
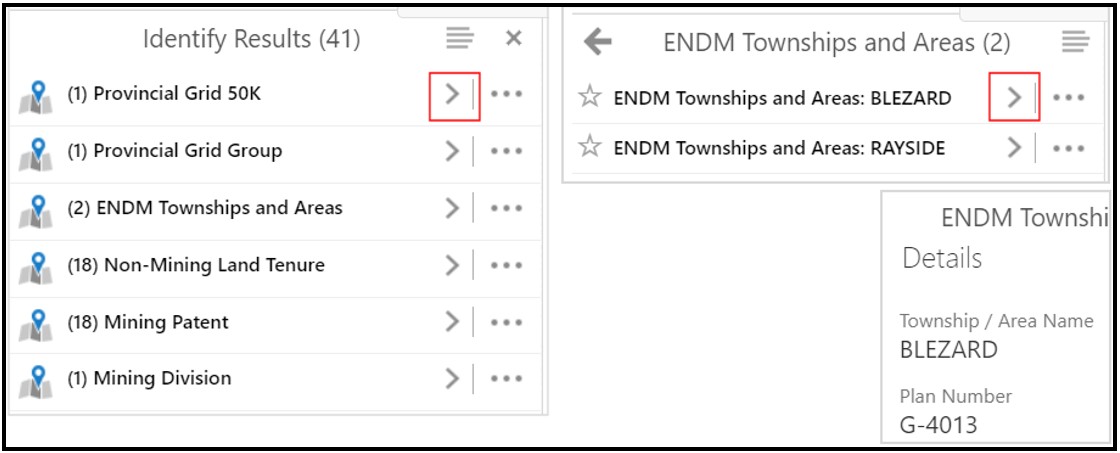
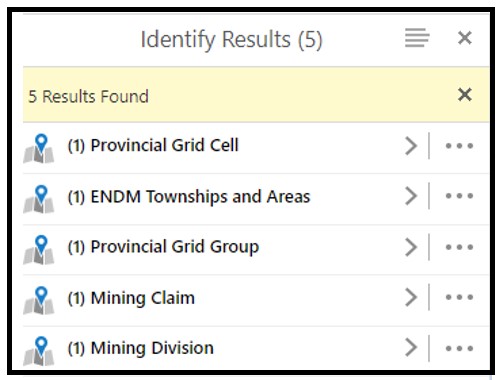
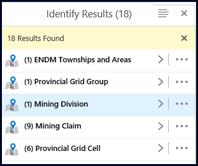
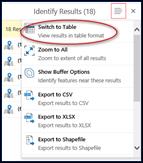
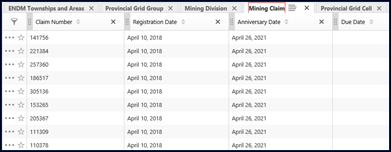
Selected results are added to the ‘results list’ or viewer’s side menu window and can also be viewed in a ‘results table’ at the bottom of the viewer. Each tab is a selected layer which displays the record for each feature selected. Clicking on a tab will highlight the selected features in the viewer. The user can also view individual selections by clicking on the selected layer in the viewer’s side menu window.
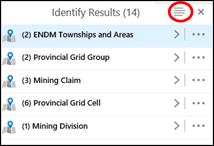
View an individual selected layer, click on the layer, then review record details by clicking on the selected feature.
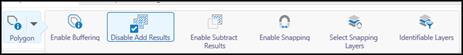
Enhanced Selection tools


Buffering to Find Layer Data
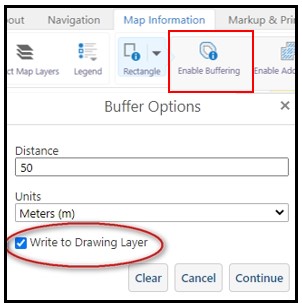
Enable Buffering - allows a user to include features in proximity of an area of interest.
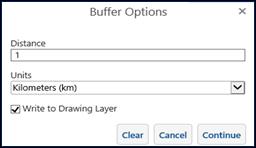
Clicking on the buffering tool opens the buffering options. Select distance and units (kilometers, mileage, meters, etc.), with the option to write the buffer outline polygon to a drawing layer (markup). Once the tool has been selected with options, click on the viewer and draw. A quick reference is displayed.
To learn what's there, click or tap and drag to draw a rectangle on the map. Note: Buffering is active. A buffer of 1 Kilometer (km) will be applied.
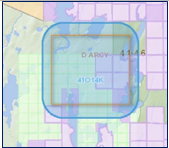
A buffer can be added to any drawing selection tool (note: the rectangle is not displayed, only the buffered area).
Results are displayed in the side window of the viewer. The selected layer or feature can be viewed, refer to the 'Find data’ section for more information.
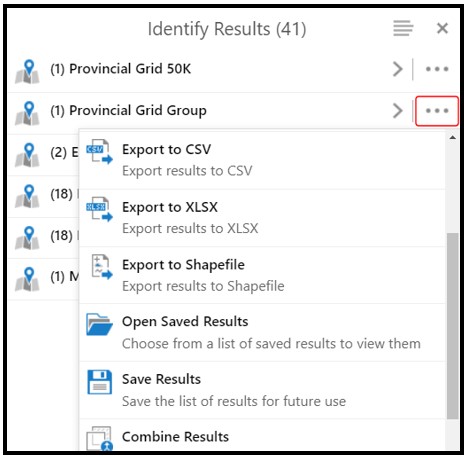
Selection options: export to different tabular formats, ESRI shapefile, save/combine/remove results, select all or zoom to all or re-select
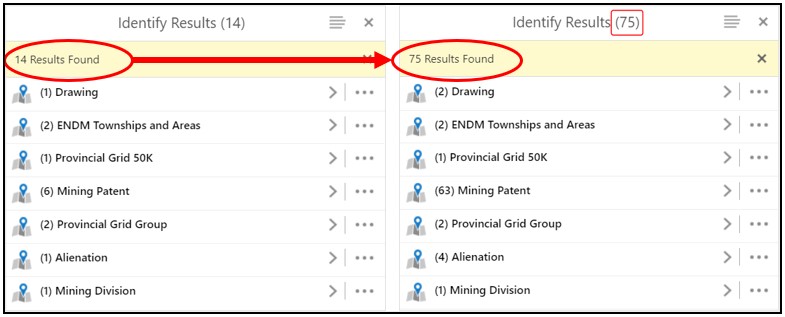
Adding and Subtracting Results
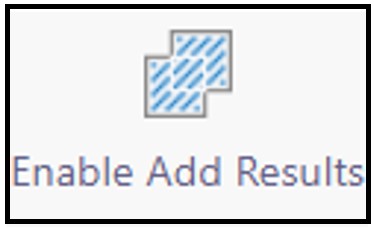
Add Results allows the user to add concurrently to an existing selection..
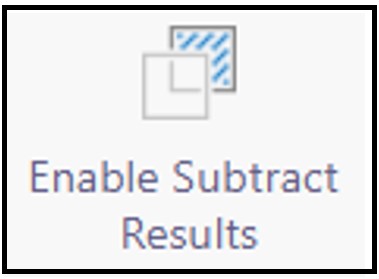
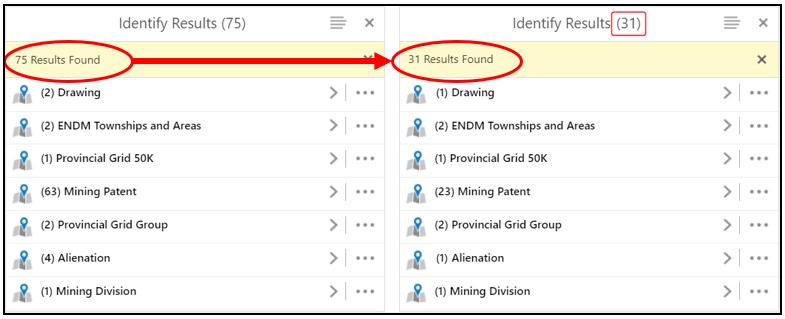
Subtract Results allows the user to remove selected features from the selection.
Snapping Tools
Provides users the ability to snap to layers in the viewer to draw a selected area with more precision (for all features except rectangle).


Find a Location
This tool provides the user with the ability to 'search and zoom' for a geographic location using one of the 11 available variables.
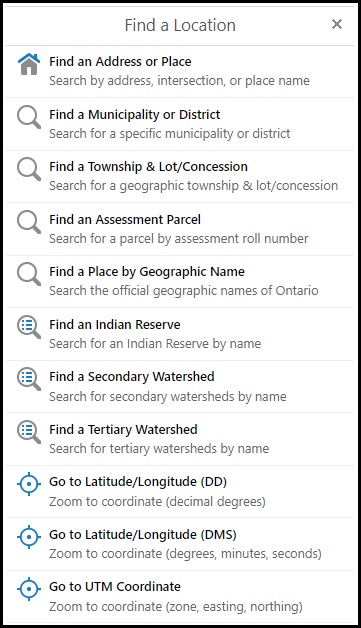
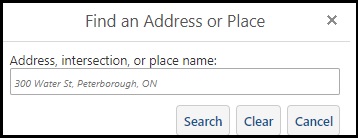
Type in an address, intersection or place name.
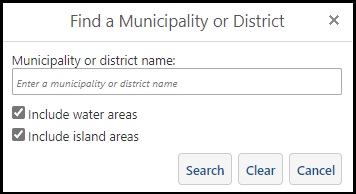
Type in the municipality or district. Options are available include or exclude water and island areas.
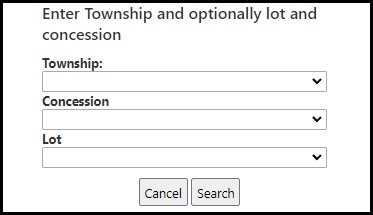
Select the township, then concession and lot using the drop-down list.
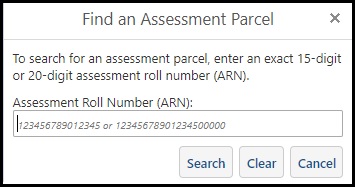
Enter the 15 or 20 digit Assessment Roll Number (ARN).
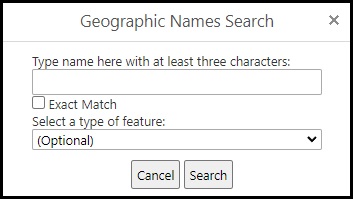
Enter the name or first 3 characters to get a list of place names. As an option, you can select the type of feature you are looking for using the drop-down list.
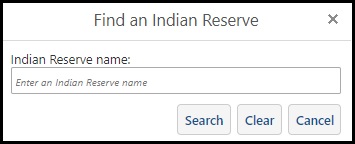
Type in the name of an Indian Reserve.
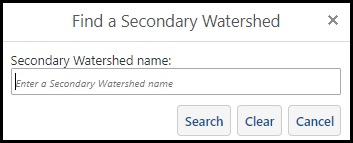
ype in the name of a secondary watershed.
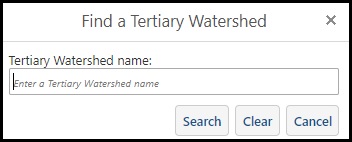
Type in the name of a tertiary watershed.
Enter a numerical value for longitude and latitude in decimal degrees.
![]()
Enter a numerical value for degree, minute and second for both longitude and latitude.
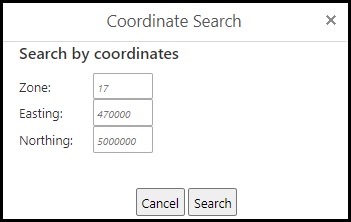
Enter a numerical value for UTM zone, easting (6 digits) and northing (7 digits).
Find a Mining Lands Location
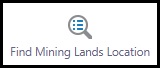
This tool provides the user with the ability to 'search and zoom' for a mining lands location using one of the 9 available variables.
![]()
Type in a Tenure ID number.
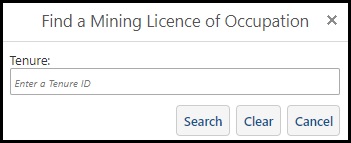
![]()
Type in a Tenure ID number.
![]()
Type in a Tenure ID number.
Type in a Tenure ID number.
![]()
Type in a Tenure ID number.
![]()
Type in the name of a Township or Area. You can also select a name from a list.
![]()
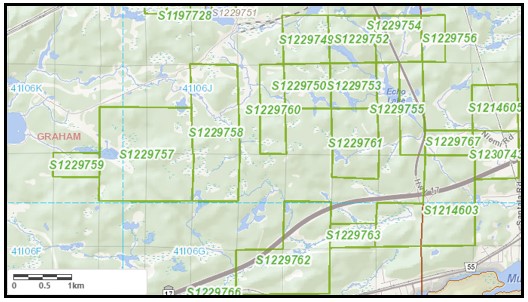
Type in a Grid Cell ID.
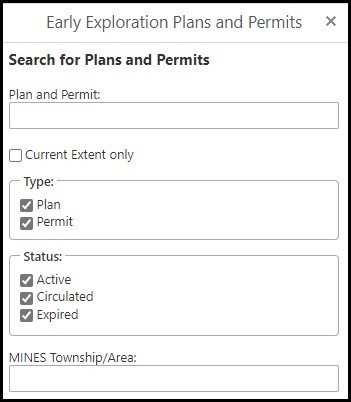
![]()
Type in a permit number. Options are available to search within the current extent, to search for plans or permits only as well as their current status 'Active', 'Circulated' or 'Expired'. Additionally, you can also search within a specific Township or Area.
![]()
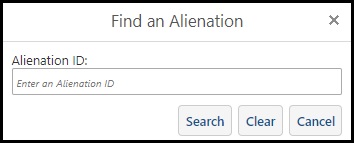
Type in an Alienation ID.
Plans and Permits searches

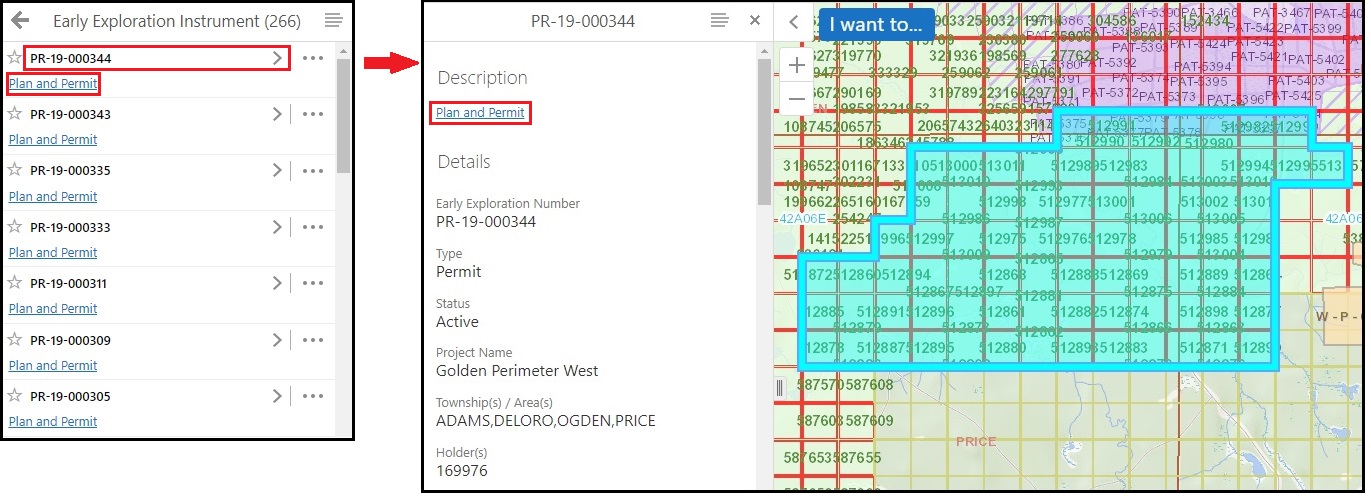
A plan or permit number is required. Selected claims will highlight once selected. Either enter the full plan (PL) or permit (PR) number or search results using only a partial number (ie. PR-19-0).
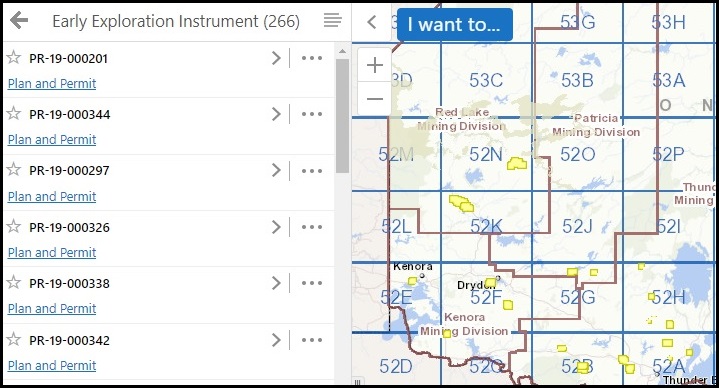
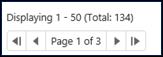
Results return 50 records at a time in the viewer window. Scroll between pages to see more queried records, the highlighted records on the map will match the records shown on the current page.
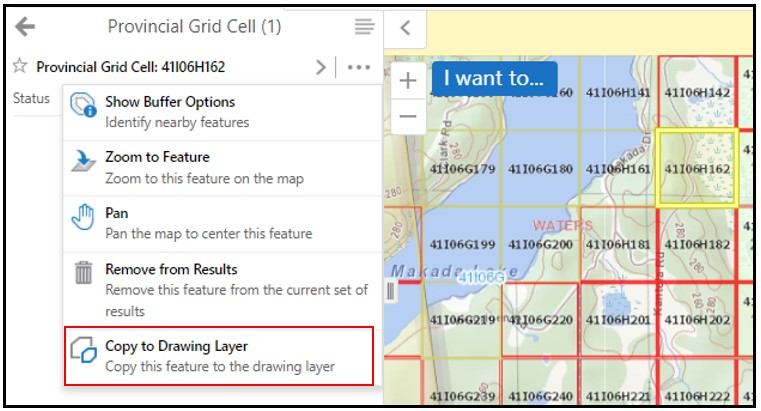
ClickClick the ‘chevron’ to open and zoom to each record. You can click the 'Plan and Permit' link to view additional information such as early exploration information, associated tenure, activities and project information.
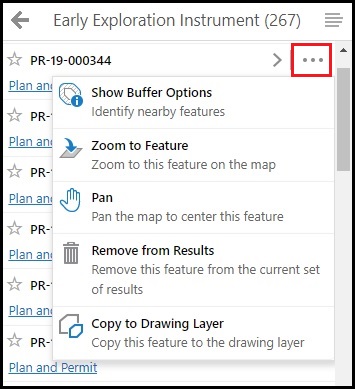
Click the ‘3 dot’ icon to open more options to buffer features, zoom to features, pan, remove from the query and copy the record to a drawing layer.
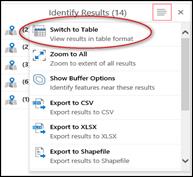
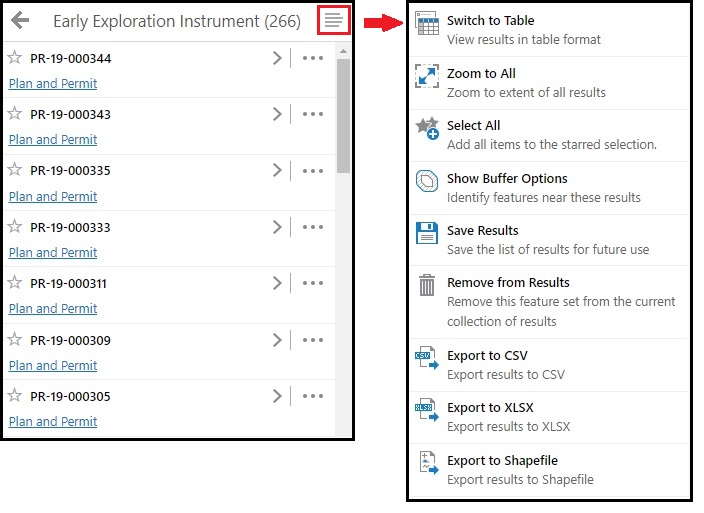
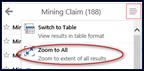
Click the ‘menu’ icon to open more options to manage the queried records. Options include exporting the results to a spatial ESRI shapefile, exporting to a CSV or XLSX, saving results, combining results, buffering the selection, switching to a table view (appears at the bottom of the viewer), zoom all, open other results, and ‘deselect'. If more than 50 records are in the query, select all records will highlight all records on the map.
Query Review

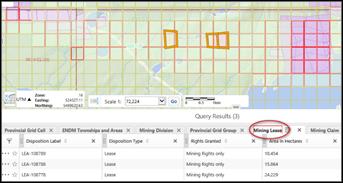
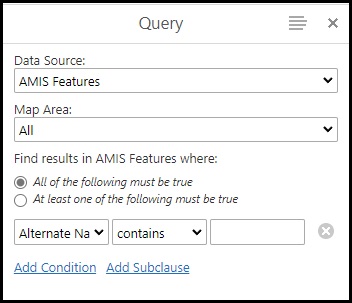
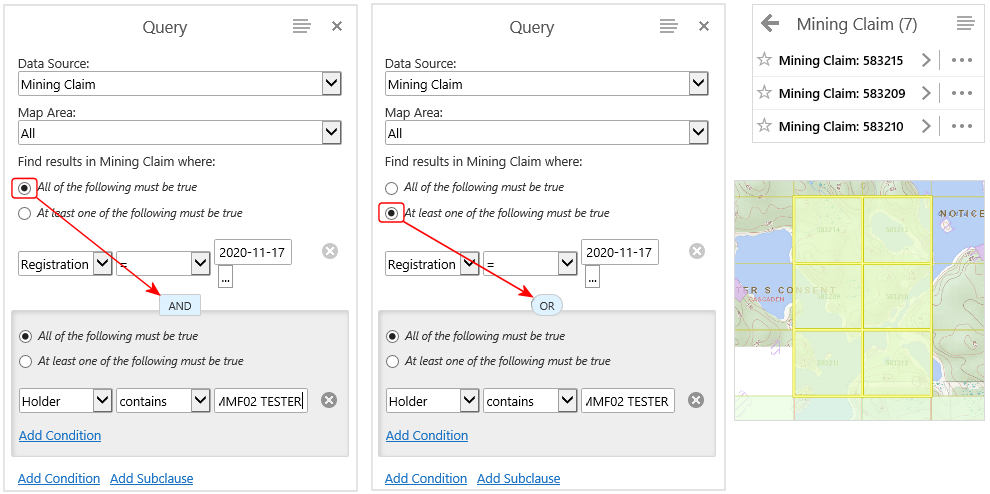
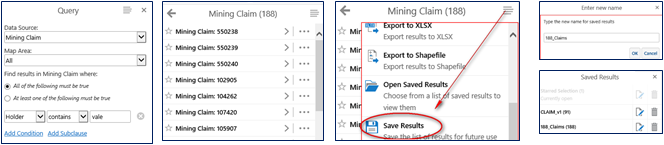
Query Tool - Allows users to query 35+ available layers and the map’s full extent or just in the current map/viewer’s extent. Users can modify the query by adding conditions or subclauses. In most cases, the field input has a preloaded drop-down list of attributes. As an example, you can query for claim holders on a specific date the claim(s) was registered, or query a withdrawal using the alienation ID.
Click the ‘menu’ icon to open more options to manage the queried records. Options include exporting the results to a spatial ESRI shapefile, exporting to a CSV or XLSX, saving results, combining results, buffering the selection, switching to a table view (appears at the bottom of the viewer), zoom all, open other results, and ‘deselect'. If more than 50 records are in the query, select all records will highlight all records on the map.
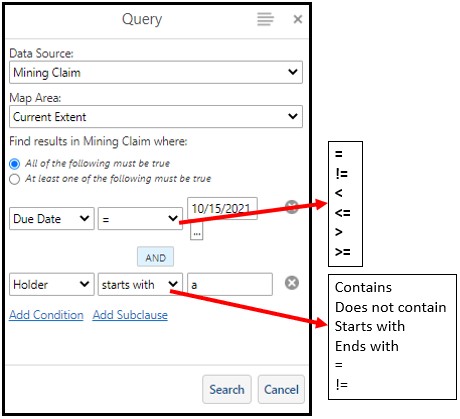
Users can query using simple queries using (predicates such as ‘=’, ‘contains’, ‘does not contain’, etc.)
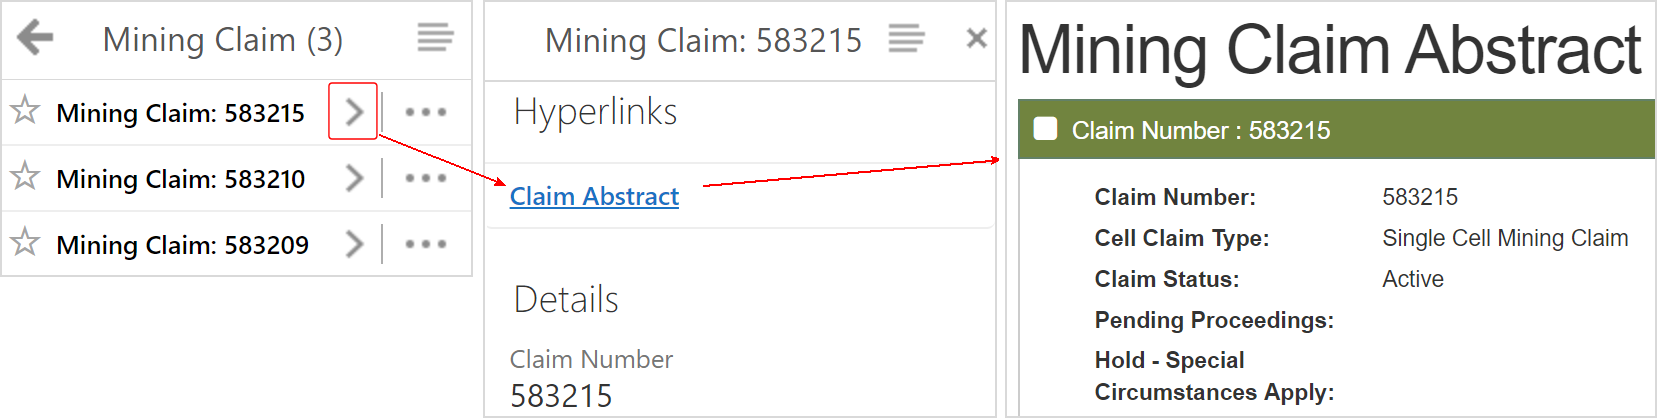
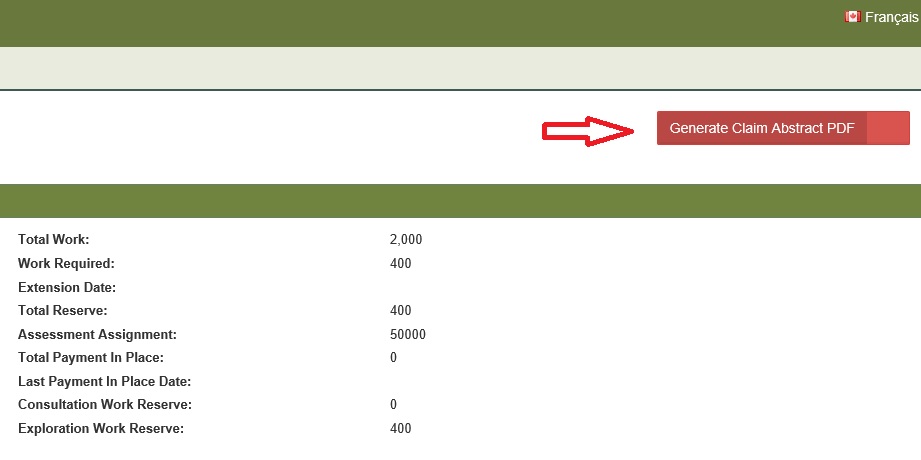
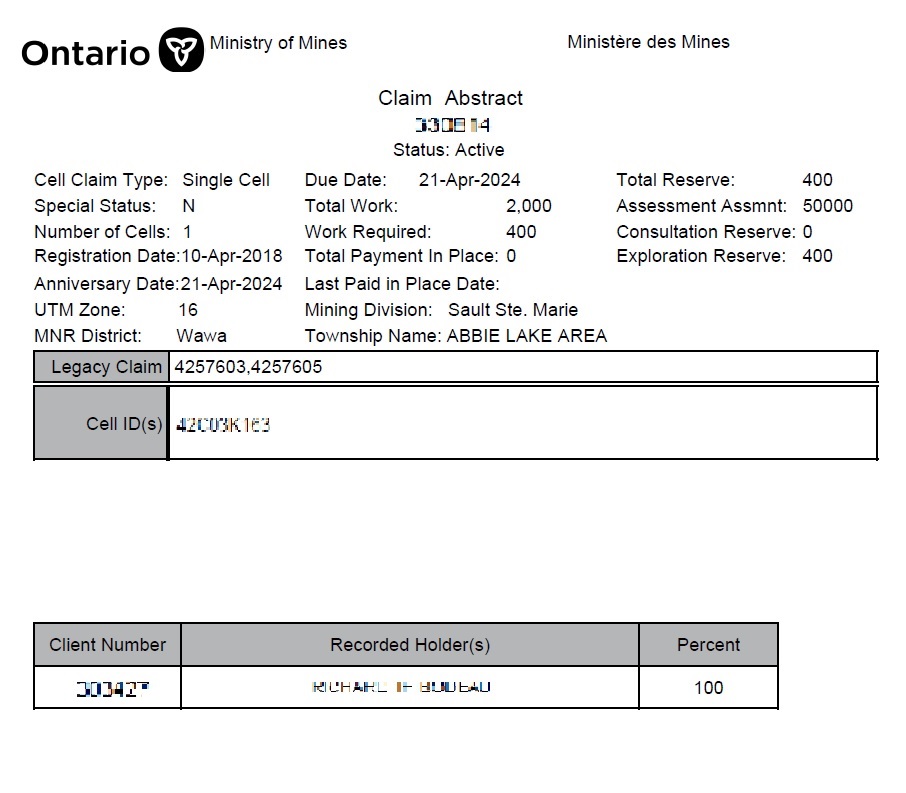
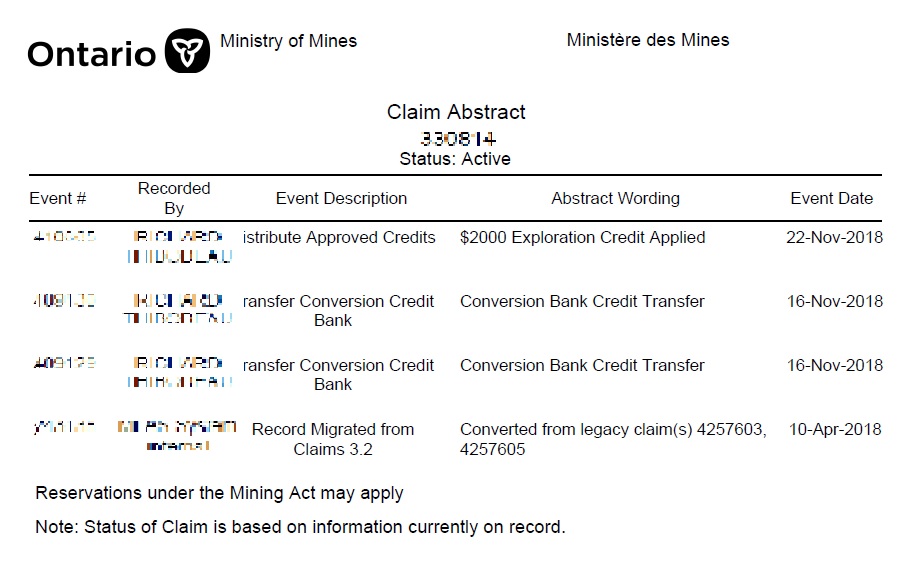
Viewing a mining claim’s abstract. The ‘Query’ tool is one of several methods to select a mining claim, or: ‘I want to….’ tool; ‘Zoom to Feature’ tool; or right click on the mouse and use the ‘Find data on the map’ function. To view the abstract of any selected mining claim, first click on the record in the viewer’s menu window or ‘chevron’ to view the polygon’s attribute, then click on the hyper-link ‘Claim Abstracts’. Initial page displays common claim attributes, clicking on the ‘Generate Claim Abstract PDF’ will provide a detailed claim abstract.
'And’ means all statements are true ‘Or’ means only one statement is true
Results return only 50 records at a time in the viewer window.
Click ‘menu’ icon and select all to view entire result on the map
The menu also provides several enhanced options such as exporting the results to a spatial ESRI shapefile, exporting to a CSV or XLSX, save results, combine results, buffer the selection, switch to a table view (appears at the bottom of the viewer), zoom all, open other results, and ‘deselect’ results.
Users can also query using simple query commands (predicates such as ‘=’, ‘contains’, ‘does not contain’, etc.)
View a mining claim abstract
To view the abstract of any selected mining claim, first click on the record in the viewer’s menu window or ‘chevron’ to view the polygon’s attribute, then click on the hyper-link ‘Claim Abstracts’. Initial page displays common claim attributes, clicking on the ‘Generate Claim Abstract PDF’ will provide a detailed claim abstract.
Measuring

Distance/Area
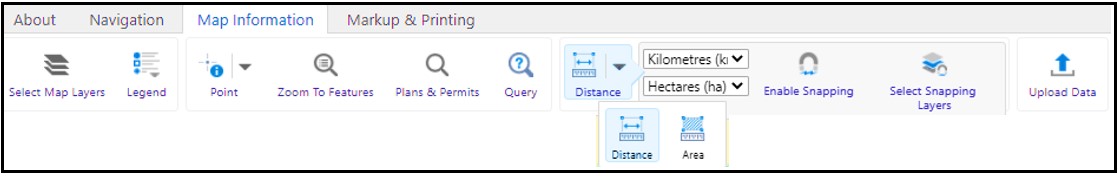
Users can measure distance or area using units of choice (Hectares, metres, etc.). Snapping to a layer ensures better accuracy. (also found in the ‘I want to….’ tool)
Click on the ‘Select Snapping Layers’ to view a list of layers (viewer’s menu window) that can be snapped to (turning off layers not required for snapping improves results).
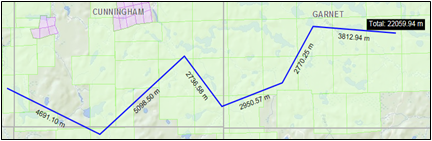
- Under the "Map Information" tab, select the "Distance" button.
- Click on a starting point on the map and continue clicking along the path you want to measure.
- Double-click to finish the line. The line measurements of each section of the line you draw will display on your screen. "Total Distance" shows the entire measurement of the line you drawn.
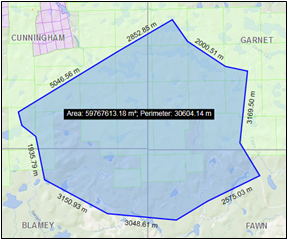
- To measure an area, select the Measure Area button under the Map Information tab.
- Click on a starting point on the map and continue clicking along the area you want to measure.
- Double-click to finish the polygon. The area and perimeter measurements will display on your screen.
- Measured lines and areas are stored in the drawing layer. They can be exported or deleted using tools in the Markup toolbar.
Upload Data
Upload Data - Data layers from other sources can now be added to the MLAS Map Viewer via the Upload Data tool. Data can be uploaded in a variety of formats, but it is recommended that data be in geographic coordinates (WGS84).
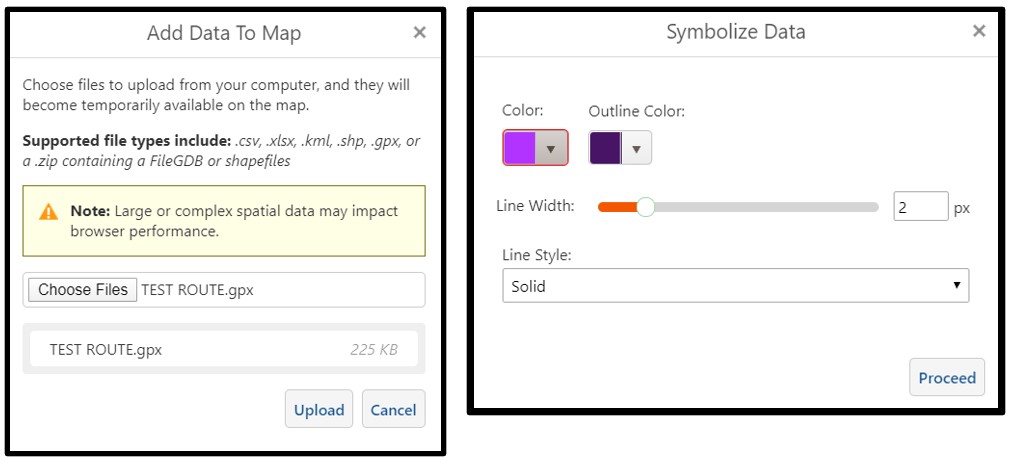
- Selecting the Upload Data tool opens a window where users select the files to upload to MLAS. Formats include .csv, .xlsx, .kml, .gps or a zip containing a File Geodatabase or Shapefile.
- Provide a name for the new layer (no spaces allowed).
- Choose the display properties (colour, line thickness).
Markup and Printing
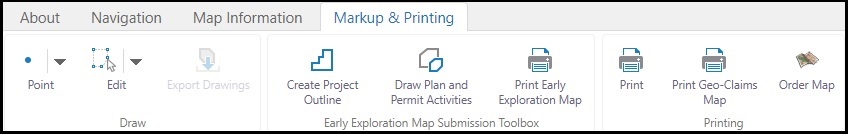
Markup is an interactive map function that allows a user to draw on the map by using the markup tools available, and/or saving selections to the drawing layer. In either circumstance, a custom map can be created with selected layers and user’s markups to be printed or downloaded to the user’s computer.
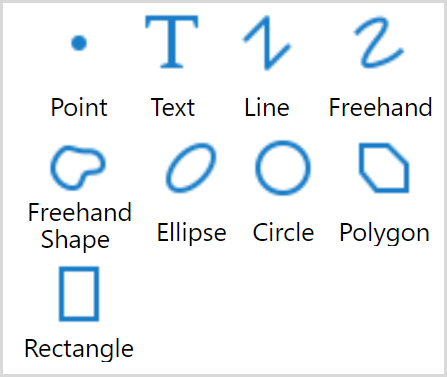
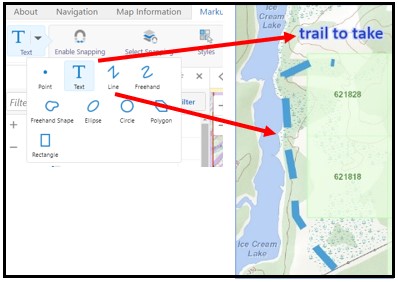
Drawing tools
There are several drawing tools available. Click on the desired tool and start drawing on the Map. All tools show a short ‘How to’ reference that pops up.
Clicking on the selected drawing tool opens enhanced options.
Click or tap a map location to add a point.
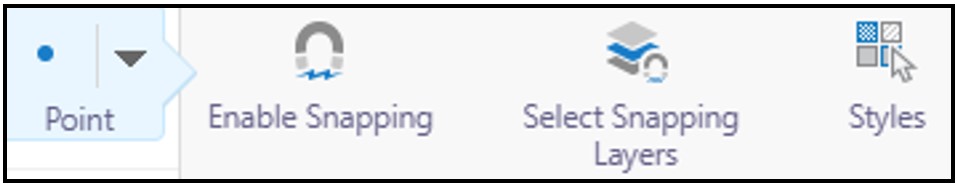
Enable Snapping - User can snap to a feature for better accuracy.
Select Snapping Layers – Option to choose which layer to snap to.
Styles – Provides options to change colours, style or custom create
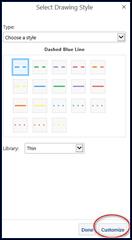
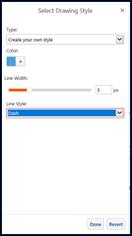

![]()
Edit – Users can Edit custom drawings by clicking on the drawing, Erase individual or multiple drawings or Clear all drawings

Label Map
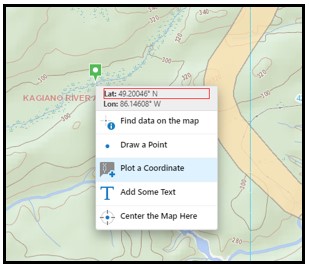
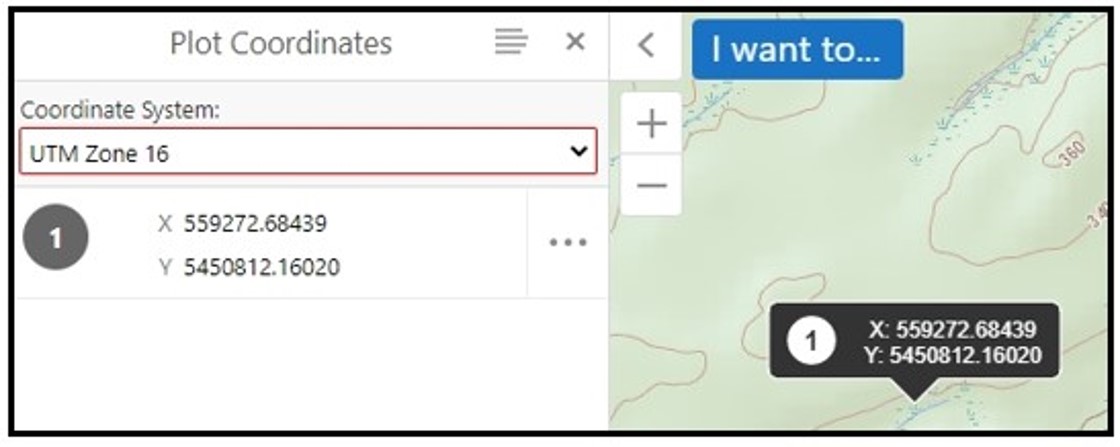
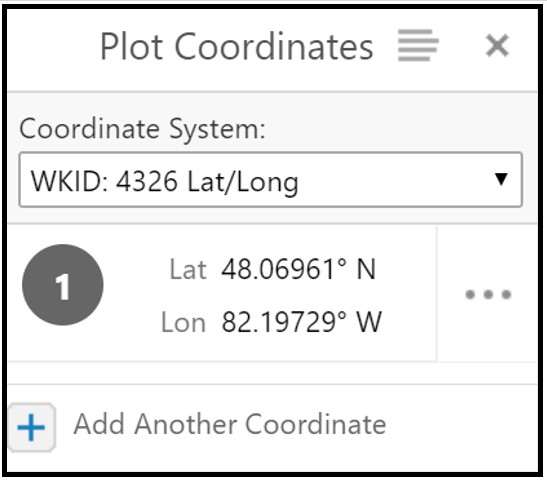
Users can use ‘push pins’ to mark a location or feature, choose the marker style and add labels (eg. coordinates).
Mark a location and add a label with the coordinates
- Zoom to a location, hover pointer over precise area and right-click to select 'plot coordinates'.
- The map coordinates can be changed to either UTM or Geographic in the menu window on the left side of the viewer.
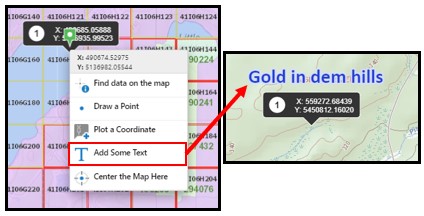
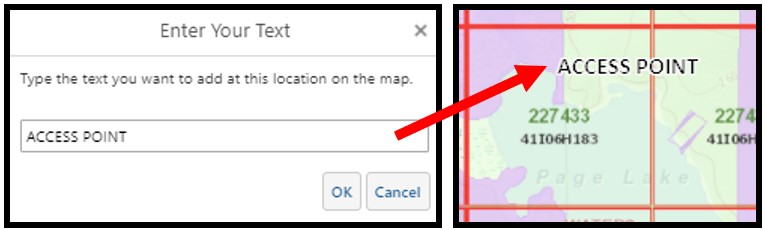
- Right-click again to add label text. Once text is added, left-click on the text to change the text style, reposition or delete.
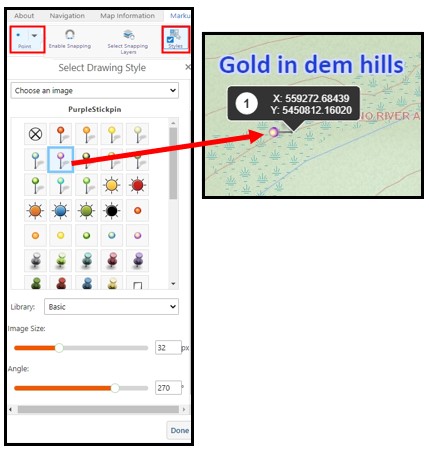
- To add a push pin or any other image from the style option, select 'draw a point' function under the Mark Up and Printing tab. Click on the styles, choose a point symbol, size and angle.
Export Drawings
There are three methods for creating drawings. Drawings can be thought of as graphic objects 'drawn' on the map. Map features that have been selected/queried can be copied to the drawing layer. Buffers can also be written to the drawing layer. The markup toolbar allows users to create features that are stored in the drawing layer. Most features in the drawing layer, regardless of how they were created, can be exported as ESRI Shapefile(s). The exceptions are text and complex features, which cannot be exported.
- Select map features and copy to the drawing layer
- Create a buffer polygon and write to the drawing layer
- Draw features using the Markup tools
Drawings can be exported to an ESRI shapefile either through the select/query tools or using the export drawings tool in the Markup toolbar. The select/query option will export only the drawing features that have been selected, while the export drawings tool will export all drawings (except text and complex features). Drawings will be exported into separate ESRI Shapefiles for each feature geometry (point, line, polygon).
Early Exploration Map Submission Toolbox
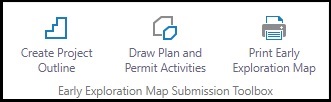
There are three tools available within the Early Exploration Map Submission Toolbox. There is the Create Project Outline Tool which allows the user to search and define their tenure. The 'Draw Plan and Permits Activities' tool where the user can draw features on the map representing early exploration types and activities. There is the 'Print Early Exploration Map' tool which allows the user to print their early exploration map with a legend defining the various exploration activities displayed on the map.
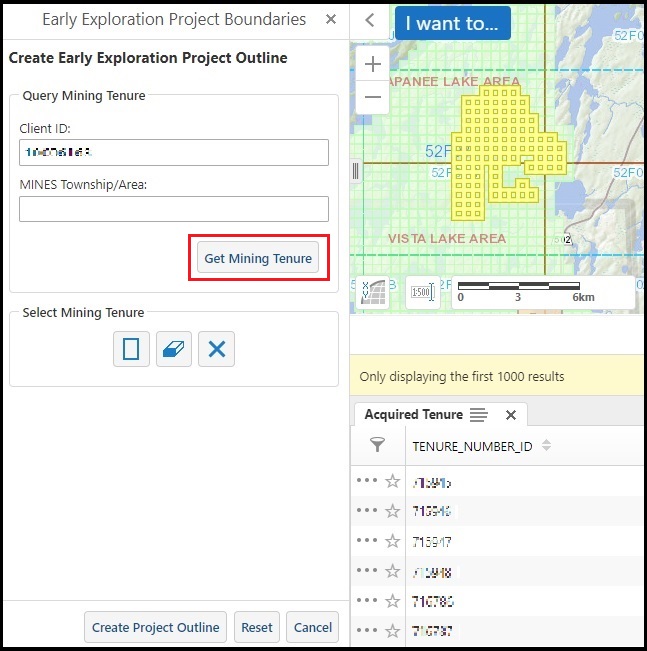
Create Project Outline
The user can enter a client ID and click the Get Mining Tenure button to see all the tenure associated with the client. A list of Tenure-Number ID's will open to allow the user to view and select the mining tenure ID(s) individually. This tool will load 1000 mining tenure ID's at a time. The user can further specify which tenure they would like to view by selecting a MINES Township/Area.
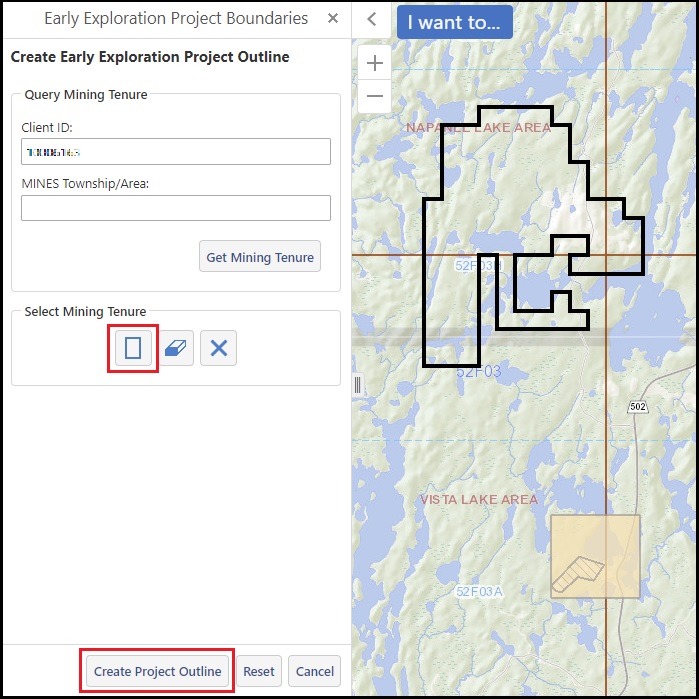
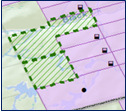
Mining Tenure can also be selected by using the Select Mining Tenure tool. A project outline can be shown by selecting the Create Project Outline tool which will create a black outline around the selected features.
Draw Plan and Permit Activities
The Draw Plan and Permit Activities tool gives the user the ability to draw features on the map representing early exploration activities categorized by type, such as a plan or permit.
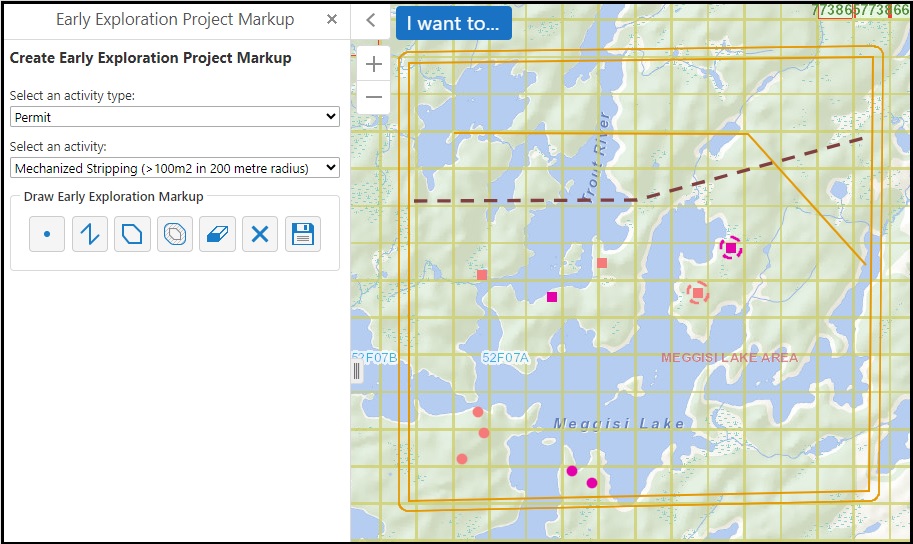
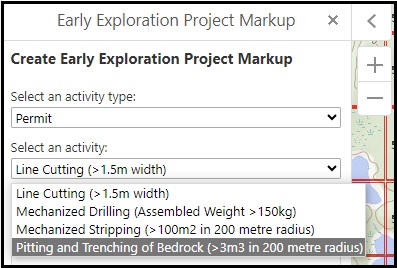
Depending on the activity type, a list of different activities will be available to choose from. Each different type and activity will have its own unique symbology on the map.
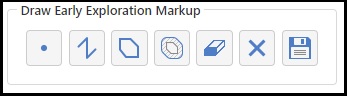
The user can select from a variety of drawing tools in the Draw Early Exploration Markup toolbox, such as point, line, polygon or buffer, to add features to the map.
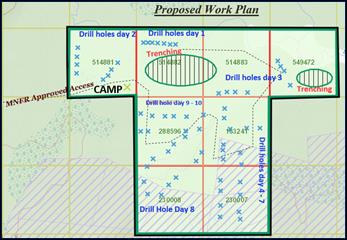
Print Early Exploration Map
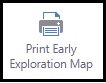
The Print Early Exploration Map tool allows the user to export and print their early exploration activities features as a map.
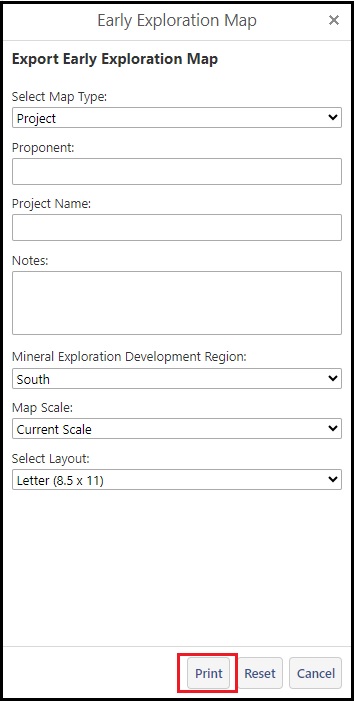
The user can select a map type, project or regional, and add additional information to the map such as Proponent, Project name and Notes. There are options to select Mineral Exploration Development Region, map scale and layout size.
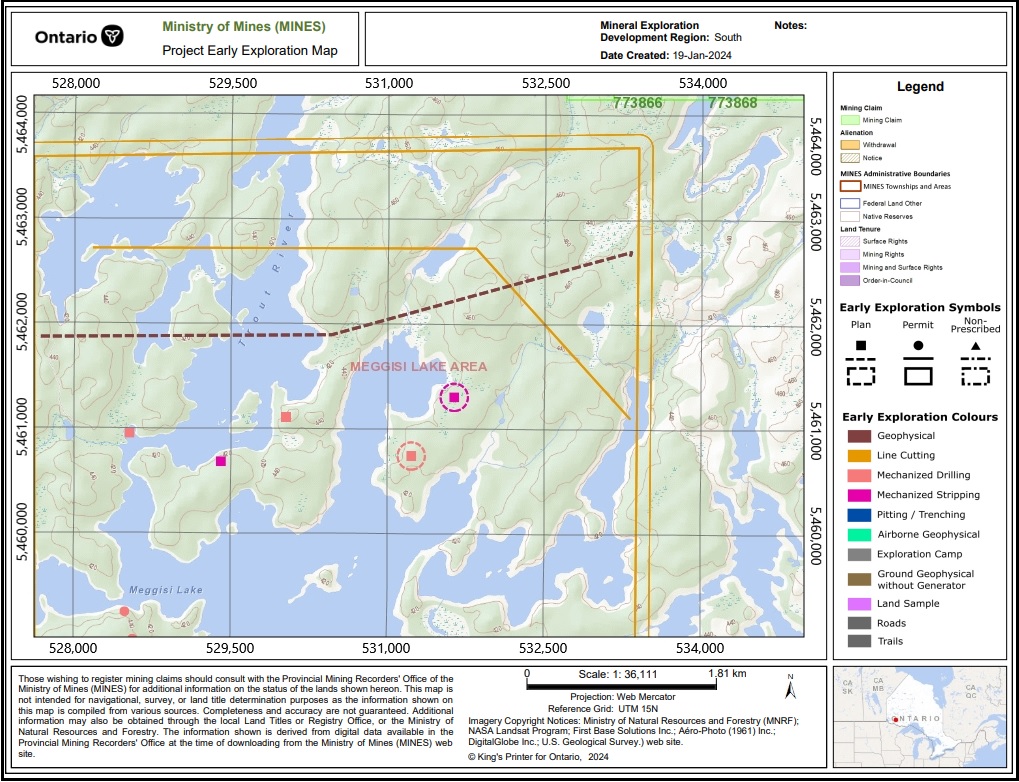
The resulting map will be opened in a new browser window and can be saved as a PDF.
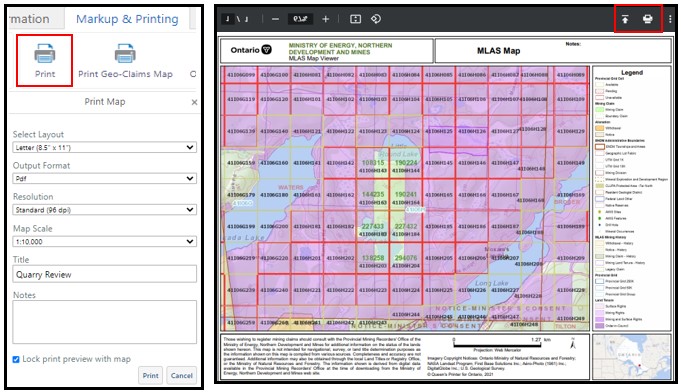
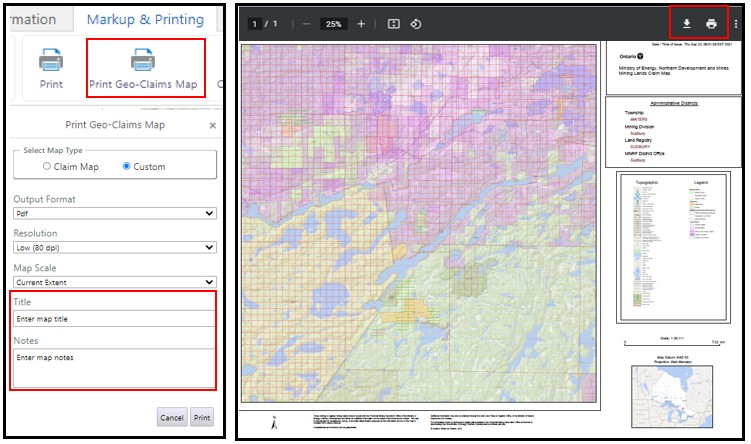
Any map can be printed to a standard printer or plotter. Click the ‘Markup and Printing’ tab to access print tools. Two options for printing a map include Print and Print Geo-Claims.
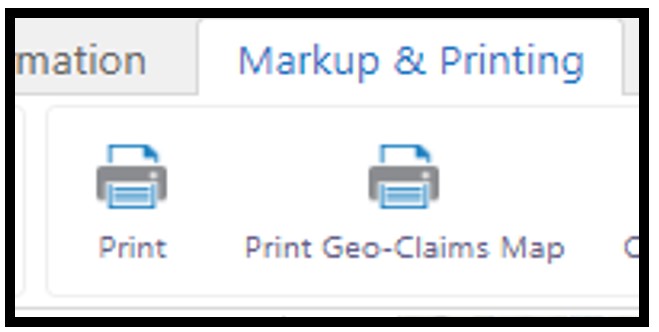
Print - Creates a PDF (or png) map for standard printers in either Letter, Legal or Tabloid size paper. Options include selecting a scale, adding a title and reference notes. Note: currently only 1 resolution option exits at 96 dots per inch, and scale options are limited (Google scales). 'Print' maps will print all markups/drawings.
Print Geo-Claims Map – Provides the user with an option to create plotter size maps (33"x44" – E size) of either an official ‘Claims Map’ or a custom map. An official Claims Map has default drawing layers that cannot be turned off, markups cannot be added, nor can a title or notes be added. Custom maps can be modified to include or exclude layers and include markups such as drawn lines or added images and a title and notes can be added. Both map types can be printed at 5 standard scales including current extent, 1:5k, 1:10k, 1:20k, 1:40k, 1:50k.
Computer Mouse Map tools
While hovering over the map viewing area, users can right click the computer mouse to access some handy ‘finger-tip’ tools.
Quickly see map coordinates (latitude and longitude)
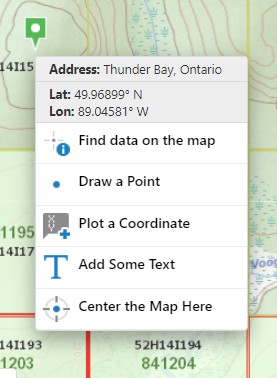
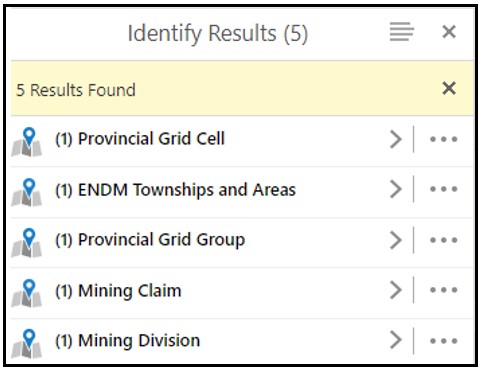
Click on ‘Find data’ and the tool will drill down all visible layers & return results to the Map viewer’s side menu window
Enter Coordinates (Lat/Long, UTM, DMS)
Quickly add text and center the map
Working with Search Results
Selected results are added to the ‘results list’ or viewer’s side menu window and can also be viewed in a ‘results table’ at the bottom of the viewer. Each tab is a selected layer which displays the record for each feature selected. Clicking a tab will highlight the selected features in the viewer. Individual selected feature can be viewed by clicking on the selected layer in the viewer’s side menu window.
Selected results are considered ‘transient’, meaning that with each new selection/identify action, the previous selection is overwritten by the new selection.
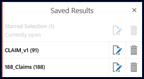
To make a selection ‘persistent’ in the current session, results can be saved, each saved result is a ‘container’ of saved records. Using tools available, a new selection can be added to the saved container or features can be deselected or removed.
Before making a selection, select the layers in which to select from, or select from available layers and only save the selected layer(s) of interest.
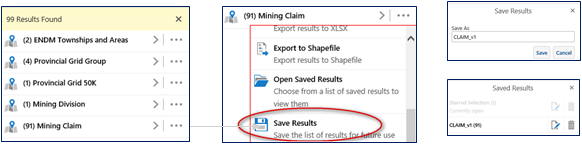
Query results can also be saved. Run the query, click on the menu of the selection results of the layer dataset and save.
Starred Selections
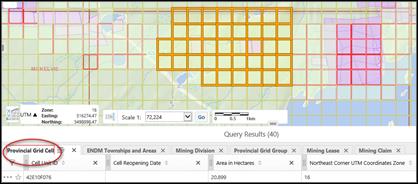
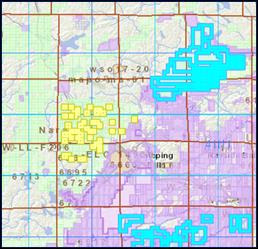
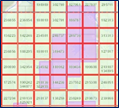
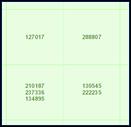
Individual selected features can be 'starred'. When a feature is starred, it is saved as a persistent result and can only be removed by unstarring it. Once a set of features are selected from one or more data layers, there is a ‘star’ icon immediately to the left of each feature. When you click on the selected data layer, it will open all features selected (by buffer, polygon, square, point, query, etc.) with a ‘star’ icon. In the example below several cells were selected from the Provincial Grid Cell layer using the ‘polygon’ tool to identity/select/search displaying the primary attribute field – grid status (ie. unavailable and why). Clicking on the ‘star’ icon immediately adds that feature to a ‘Starred Selection’ that can be viewed anytime.
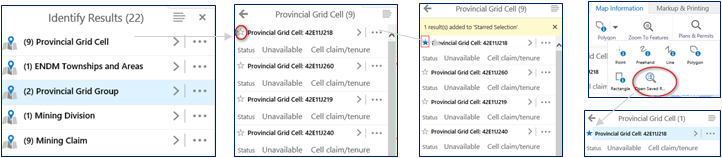
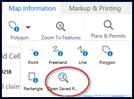
Working with a selected feature as a starred selection allows the user to see the selected feature while selecting another underlying or adjacent feature. Select ‘all’ and saved selected features are highlighted differently from a selection that is not saved and in the list results window. To view the starred selected feature, click on the identify tool and from the drop-down list, click on ‘Open Save Results’. By default, the starred selection list opens, to view other non-starred saved results, click on the menu icon and open saved results.
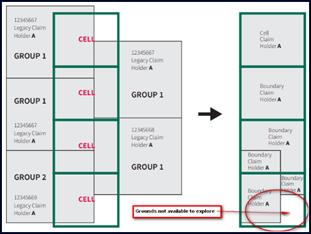
Understanding Boundary Claims
Conversion: was the process of taking existing recorded ground or map staked mining claims (legacy claims) and transforming them into one or more cell claims or boundary claims on the provincial grid. As of April 10, 2018, all legacy claims converted at once. Legacy claims did not cancel but continued as cell claims or boundary claims that resulted from conversion.
Boundary claim: As defined in the Mining Act, a boundary claim is created at conversion when there are multiple legacy claims within a cell that cannot merge into a cell claim. There are two circumstances where mining claims will not merge into a cell claim:
- When the legacy claims are held by different holders
- When the legacy claims are held by the same person who chooses to keep them separate by making an election through the Claim Boundary Report process
Note: You will need to know the legacy claim number in which the boundary claim was converted from – see boundary claim abstract
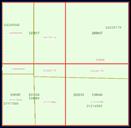
Legacy claims physically staked and digitized on the map
Legacy claims paper staked and digitized on the map
Legacy claims converted to cell grid claims on April 10, 2020
The online system (the Mining Lands Administration System) is structured using ‘cells’ as the smallest unit, each cell is a container of mining lands – potentially open lands, lands not opened, lands withdrawn from prospecting, lands with existing tenure, etc.
MLAS displays ‘cells’. To view a boundary claim’s extent turn on the Mining Claim - History layer under the ‘Select Map Layers’ tab.
'White’ space or unclassified ground often exists within a boundary cell. Where 2 or more boundary claims within a cell do not cover all available ground within the cell’s extent, the holder(s) could merge, forfeit and/or abandon boundary claims until a single registration remains. For more information on boundary claims read the Claim Holders Guide to Conversion.